3.1 COORDINATES
![]()
INTRODUCTION |
You have already made your first experience drawing with the turtle on the computer. However, the turtle has its limits and so now you will get to know more flexible options of creating graphics output. |
OPENING THE GRAPHIC WINDOW |
|
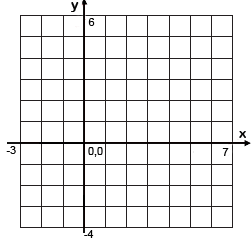
The library (respectively the window for the graphics output) is called GPanel. This library is already installed in TigerJython but you must still specify that you want to use the GPanel and therefore start your program with an import. Then you can use makeGPanel() to create a new graphics window: from gpanel import * makeGPanel(-3, 7, -4, 6)
In this example you specify the x- and y-coordinate range with the four numbers -3, 7, -4, and 6. -3 is the x-coordinate on the left edge, 7 is the x-coordinate on the right edge, -4 is the y-coordinate on the bottom edge and 6 is the y-coordinate on the top edge. |
MEMO |
|
You can create a window with makeGPanel().
You can define the desired area of the coordinate system with four numbers:
makeGPanel(xmin, xmax, ymin, ymax)
You can also specify a window title as the first parameter: |
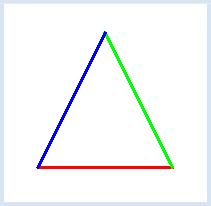
DRAWING LINES |
from gpanel import * makeGPanel("My window", 0, 6, -2, 4) |
MEMO |
|
You can specify the width of the line in pixels using the function lineWidth(). |
CIRCLES AND RECTANGLES |
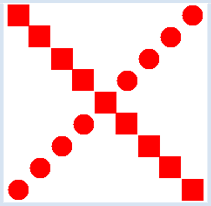
from gpanel import * makeGPanel(0, 20, 0, 20) setColor("red") x = 2 y = 2 while y < 20: move(x, y) fillCircle(1) move(x, 20 - y) fillRectangle(2, 2) x = x + 2 y = y + 2 |
MEMO |
|
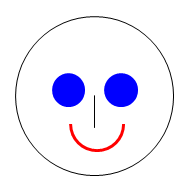
You can draw many different figures with GPanel. Here are the most important commands:
For circles, arcs, ellipses, text, and rectangles that are simply defined by length and width, you must first determine their position by setting the graphics cursor using move(). GPanel knows the so-called X11 colors. There are a few dozen color names that you can find on the Internet here: http://cng.seas.rochester.edu/CNG/docs/x11color.html. You can choose all of these colors using setColor(color). |
EXERCISES |
|


