3.12 PRINTING IMAGES
![]()
INTRODUCTION |
|
You have already learned how to let the turtle draw on a high resolution printer in the chapter Turtle Graphics. You can similarly render an image from GPanel on the printer. You can also use a virtual printer that creates a graphic file in high resolution format (such as Tiff or EPS) [more... For example Image Printer]. To do this, you define a parameterless function with any name such as doIt() that will contain all of the commands necessary to create the image. With a direct call, the image will appear on the screen. To print it, call printerPlot(doIt). You can also specify a scaling factor k, and if you do, call printerPlot(doIt, k) instead. If k < 1 it results in a reduction, and if k >1 it results in an enlargement. |
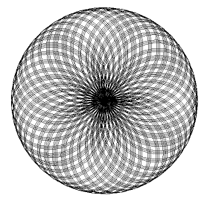
ROSETTES |
from gpanel import * import math def rho(phi): return math.sin(n * phi) def doIt(): phi = 0 while phi < nbTurns * math.pi: r = rho(phi) x = r * math.cos(phi) y = r * math.sin(phi) if phi == 0: move(x, y) else: draw(x, y) phi += dphi n = math.sqrt(2) dphi = 0.01 nbTurns = 100 makeGPanel(-1.2, 1.2, -1.2, 1.2) doIt() printerPlot(doIt) |
MEMO |
|
Depending on the choice of the parameter n, you can create different kinds of curves. Try it with natural numbers, rational numbers (fractions), and with irrational numbers (π, e). |
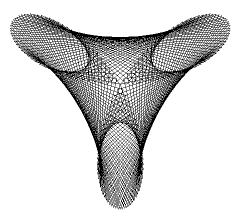
MAURER ROSES |
from gpanel import * import math def sin(x): return math.sin(math.radians(x)) def cos(x): return math.cos(math.radians(x)) def cartesian(polar): return [polar[0] * cos(polar[1]), polar[0] * sin(polar[1])] def rho(phi): return sin(n * phi) def doIt(): for i in range(361): k = i * d pt = [rho(k), k] corners.append(pt) move(cartesian(corners[0])) for pt in corners: draw(cartesian(pt)) corners = [] n = 3 d = 47 makeGPanel(-1.2, 1.2, -1.2, 1.2) doIt() printerPlot(doIt) |
MEMO |
|
In the program you use degrees, not radians. Therefore, it is convenient to define your own functions for sine and cosine that calculate with degrees. This also simplifies the notation, since you will not always need to write math. beforehand. Likewise, it is convenient to make a conversion from polar to Cartesian coordinates in the function cartesian(), where the coordinate pairs are packaged as a list. Save the polar coordinates of the 361 points which you select from the guideline in the list corners. In the end, you run through them and draw lines from point to point using draw().
|
EXERCISES |
|