deutsch     english    français     Print


3.1 COORDINATES


INTRODUCTION


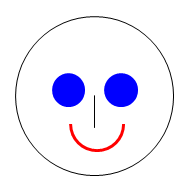
You have already made your first experience drawing with the turtle on the computer. However, the turtle has its limits and so now you will get to know more flexible options of creating graphics output.

PROGRAMMING CONCEPTS: Coordinate graphics, Cartesian coordinate system


OPENING THE GRAPHIC WINDOW


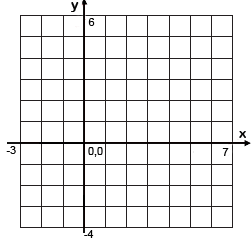
The library (respectively the window for the graphics output) is called GPanel. This library is already installed in TigerJython but you must still specify that you want to use the GPanel and therefore start your program with an import. Then you can use makeGPanel() to create a new graphics window:

from gpanel import *
makeGPanel(-3, 7, -4, 6)

So far, the program does not do anything very exciting as it only shows a blank window that you can then close again. Your GPanel window is always square and uses an x-y-coordinate system, as you should know from mathematics:

In this example you specify the x- and y-coordinate range with the four numbers -3, 7, -4, and 6. -3 is the x-coordinate on the left edge, 7 is the x-coordinate on the right edge, -4 is the y-coordinate on the bottom edge and 6 is the y-coordinate on the top edge.


MEMO

 
You can create a window with makeGPanel(). You can define the desired area of the coordinate system with four numbers: makeGPanel(xmin, xmax, ymin, ymax)

You can also specify a window title as the first parameter:
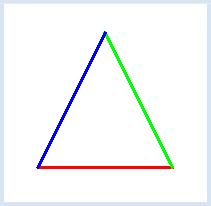
makeGPanel(title, xmin, xmax, ymin, ymax)


DRAWING LINES


Once the window is open, you can begin drawing in it just as you like. There are a number of useful functions that can help. For example, with line() you can draw a line, and with setColor() you can alter the color. You can then, for example, draw a colorful triangle.

For each line, you first specify the x- and y-coordinates of the start point, then the x- and y-coordinates of the end point. The vertices should have the following coordinates: (1, -1) (5, -1) (3, 3). Of course you can only see the triangle if you choose the coordinate system appropriately. Undistorted drawings will only appear if the coordinate system is the same length in both the x- and y-direction.


from gpanel import *

makeGPanel("My window", 0, 6, -2, 4)

lineWidth(3)
setColor("red")
line(1, -1, 5, -1)
setColor("green") line(5, -1, 3, 3) setColor("blue") line(3, 3, 1, -1)
Highlight program code (Ctrl+C copy, Ctrl+V paste)


MEMO


You can specify the width of the line in pixels using the function lineWidth().


CIRCLES AND RECTANGLES


GPanel can draw not only lines, but also circles, ellipses, rectangles, triangles, and arcs. It can even write out texts. You can draw a filled circle with the command fillCircle(radius). But before you draw a circle, you need to position the graphics cursor using move(x, y) in order to define the center point.

fillRectangle(length, width) draws a rectangle with its center at the position of the graphics cursor. In our example, we draw several squares and circles using a while loop.


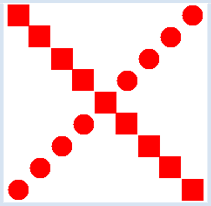
from gpanel import *

makeGPanel(0, 20, 0, 20)

setColor("red")
x = 2
y = 2
while y < 20:
    move(x, y)
    fillCircle(1)
    move(x, 20 - y)
    fillRectangle(2, 2)
    x = x + 2
    y = y + 2
Highlight program code (Ctrl+C copy, Ctrl+V paste)


MEMO


You can draw many different figures with GPanel. Here are the most important commands:


point(x, y)

line(x1, y1, x2, y2)

rectangle(width, height)

fillRectangle(width, height)

rectangle(x1, y1, x2, y2)

fillRectangle(x1, y1, x2, y2)

fillTriangle(x1, y1, ..., y3)

circle(r)

fillCircle(r)

ellipse(a, b)

fillEllipse(a, b)

arc(r, a, b)

text("t")

move(x, y)

A point

A line

A rectangle (width, height)

A filled rectangle

A rectangle (vertices)

A filled rectangle

A triangle (vertices)

A circle with radius r

A filled circle

An ellipse with axes a, b

A filled ellipse

An arc

Writes the text t

Determines position


For circles, arcs, ellipses, text, and rectangles that are simply defined by length and width, you must first determine their position by setting the graphics cursor using move().

GPanel knows the so-called X11 colors. There are a few dozen color names that you can find on the Internet here: http://cng.seas.rochester.edu/CNG/docs/x11color.html. You can choose all of these colors using setColor(color).


EXERCISES


1.


Draw a similar figure:


2.


What does a rainbow actually look like? Let the computer draw you a rainbow. Use the function circle(r) so that only the upper part of the circle is visible.